Incumbent operators continue to lose share in the business market

The 2018 financial results for operators’ business divisions illustrate the clear distinctions between different types of operators. Challengers are finding revenue growth in the business market, mostly from selling connectivity and largely at the expense of incumbents, whose connectivity revenue continues to fall. Incumbents are reliant on ICT, and often acquisitions, for revenue growth.
For most challengers, the strategy is clear: focus on connectivity and be price-competitive. There are no easy answers for incumbents, however. They can try to not compete on price, but this will probably lead to a loss of market share and revenue. Alternatively, they can compete on price to maintain their market share, but their revenue will decline. As such, incumbents have little choice but to explore the ICT opportunity if they want to grow revenue. However, penetrating this market is risky, requires significant investment (often through acquisition) and is no guarantee of sustainable growth (as some operators, such as Swisscom, are discovering).
The data in this article is from our ongoing enterprise revenue tracker. Our analysis of the 2017 results can be found here.
Challengers continue to win market share from incumbents
Figure 1 illustrates the mixed picture in terms of financial results for the different types of operators. The data in this figure is based on a simple average1 of the 35 operators that report business revenue splits worldwide. Some caveats should be considered with this data. Not all operators report full business revenue splits; some only report a portion of their business revenue (such as Verizon that only reports fixed revenue) and some exclude smaller businesses. However, the results still give useful insights.
Figure 1 shows that revenue growth for incumbents is flat, challengers are reporting moderate growth and the average operator’s revenue grew slightly by 1.4% (an improvement over that of 2017). The weighted average shows that the total value of the market declined by 1.7%.
Figure 1: Change in operators’ business revenue, 2017–2018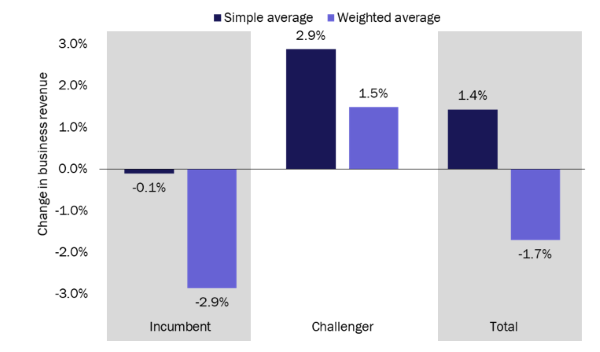
Source: Operators and Analysys Mason, 2019
The growth in challengers’ revenue is generally at the expense of incumbents. Technology shifts (such as a move to hosted voice) can drive businesses to change suppliers, and incumbents will therefore often lower renewal costs in order retain customers and avoid churn.
Incumbents tend to be larger than challengers and any revenue declines from particularly large incumbents have a significant impact on the overall growth in the market. For example, AT&T alone accounts for 25% of the overall revenue in the sample used here, and its business division revenue declined by 5.4%, thereby dragging down the weighted growth rate. The weighted average in the sample is only –0.4% excluding AT&T.
The revenue growth rates are even more negative when ICT services are excluded
A subset of the operators that report business revenue provides detail on connectivity and ICT revenue. Again, a caveat is needed as the definition of what falls under ICT services can differ between operators. The overall growth rates of many (mostly incumbent) operators hide the underlying divergence in revenue growth for connectivity and ICT services (that is, non-connectivity services such as cloud and security).
Operators such as Orange and Telefónica reported positive overall growth rates, but this was due to ICT service revenue offsetting declines in connectivity. Indeed, only one operator out of those that report ICT revenue (the Australian challenger Macquarie Telecom) reported a positive growth rate for connectivity service revenue. All of the growth for the other operators in this sample comes from ICT services (Figure 2).
Figure 2: Change in operators’ business connectivity and ICT revenue, 2017–2018
Source: Operators and Analysys Mason, 2019
Much of the growth in ICT service revenue is inorganic. Operators have mostly used acquisition to penetrate the ICT market. For example, KPN had the highest ICT revenue growth in the sample, and made at least five ICT-related acquisitions in 2017, all of which will have inorganically boosted KPN’s revenue growth rate in 2018. Our enterprise-related M&A tracker shows that acquisitions were made by many of the operators in Figure 2 between 2017 and 2018 which suggests that the 5% average growth rate for ICT service revenue is lower when only organic growth is considered.
Swisscom’s results show that having a large, mature ICT business is no guarantee of securing growth. It made many IT services firm acquisitions in the years prior to 2017 (but none during 2017 and 2018), but reported a similar decline both ICT business revenue and connectivity revenue in 2018. Swisscom estimates that it has around an 11% share of the Swiss ICT services market, making it one of the largest ICT providers in the country. Finding further growth is proving to be elusive.
Broadly speaking, most challengers still have the option to focus on connectivity in order to find growth. However, a few challengers such as VodafoneZiggo in the Netherlands have a high market share and will face similar pressure to incumbents. They may need to consider other options to grow revenue.
Challengers and incumbents should consider the long-term implications of their growth strategies
Most operators that are currently exploring the ICT opportunity are reporting growth in these services, despite the caveats. New technologies (such as VoIP and SD-WAN) and OTT players will put further pricing pressure on an already competitive market. Incumbent operators have little choice but to explore new opportunities if they wish to grow revenue. Most challengers still have the potential to generate revenue growth from connectivity services.
1 The simple average is calculated as average of the sum of the growth rates of each operator. The weighted average is calculated as the change in the sum of the revenue of all the operators.