Operators need new profitability metrics to measure the real value of diverse business groups
"Lower EBITDA margins in business divisions can negatively impact group-level metrics."

Telecoms operators have extensively modernised and broadened their enterprise offerings to boost business revenue. As a result, IT services now constitute a significant and growing share of business revenue (up to 49% for Orange, for example), generated from services such as cyber security, cloud computing and managed IT.
However, as operators shift away from core connectivity services, they must look beyond top-line figures when assessing their business divisions’ performance and profitability. Only then will they be able to evaluate competitiveness against internal benchmarks and external peers.
Analysys Mason analysed five major European incumbent operators (BT, Elisa, KPN, Orange and Swisscom) that have consistently published detailed financial and operational data for their business units since 2020. We used this data to compare the financial performance of the operators’ business and consumer units.
This analysis reveals that, on average, business and consumer revenue has grown for all five operators. However, in business divisions, EBITDA per employee was lower than in consumer divisions by an average of 67% in 2024, and this figure has declined for business divisions since 2021. In contrast, consumer EBITDA per employee increased over the same period (Figure 1).1
Figure 1: Average year-on-year change in revenue and EBITDA per employee for BT, Elisa, KPN, Orange and Swisscom in business and consumer divisions

The gap between business and consumer divisions is growing when measured through traditional indicators, such as EBITDA per employee and EBITDA margins. However, this highlights structural differences between the two segments rather than reflecting a discrepancy in profitability.
The shift towards IT services partly explains the decline in EBITDA margins for business divisions, which can misrepresent the profitability of these units. Consumer divisions operate in mature, consolidated markets with well-established, recurring revenue models. In these divisions, key priorities for operators include efficiency and resource optimisation, particularly in the form of workforce reduction.
In contrast, business divisions are increasingly resembling IT consultancies, offering services that are more targeted and less scalable than consumer services. The transition to IT services and the strategic intent to move beyond simple resale models have significantly altered cost structures, which makes these units more labour-intensive and investment-heavy. For instance, for the group of operators analysed, employee costs typically amount to around 30% of revenue in business units, compared to 17% in consumer units. As a result, the cost structures of business divisions are increasingly diverging from those of consumer divisions, which rely more heavily on connectivity.
Lower EBITDA margins in business divisions can negatively affect group-level metrics
For three out of the five operators analysed, EBITDA margins are lower in the business division than on the group level. The group-level margins, in turn, are lower than the consumer unit margins (Figure 2).
Figure 2: Orange’s and Elisa’s EBITDA margins for the group level and business and consumer divisions
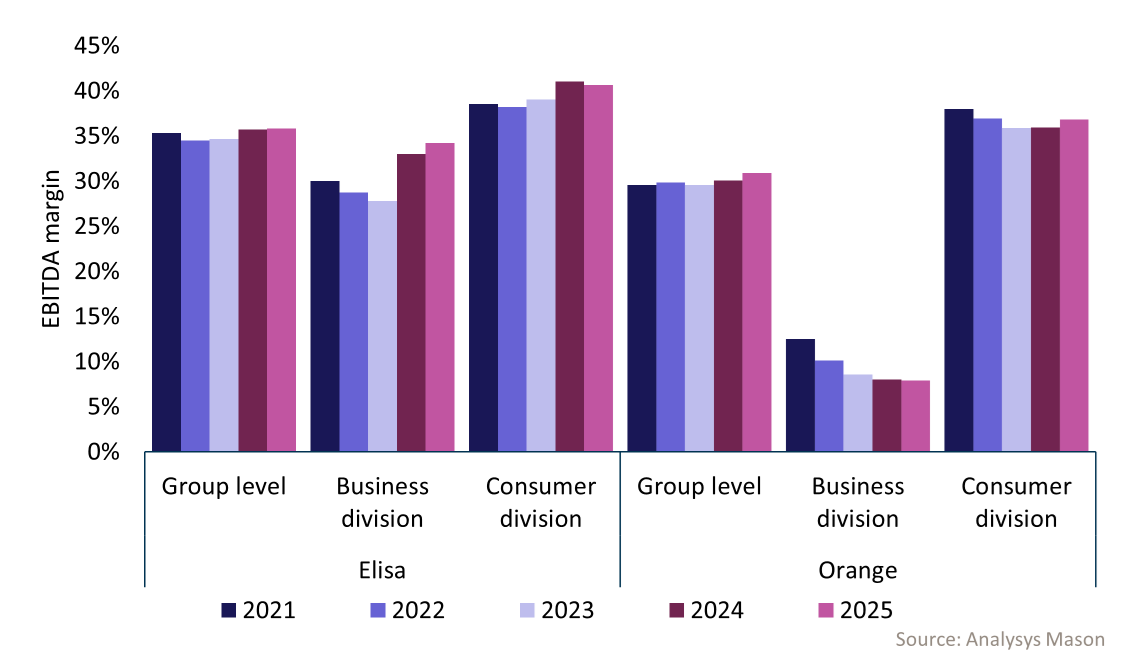
The business unit’s lower EBITDA margin can drag down the group margin, with the associated risk of obscuring productivity improvements in other segments, such as those in the consumer units.
The issue with traditional financial metrics extends beyond methods for assessing the productivity of business divisions. For example, some operator groups, such as Orange or BT, include more capital-intensive divisions in their reporting (like TOTEM for Orange or Openreach for BT) that typically have much higher EBITDA margins than those of the operators' group level.
These figures show that traditional indicators are less effective for comparing units that offer fundamentally different types of services. In some cases, the pressure to demonstrate EBITDA growth drives operators to resort to financial engineering in cost reporting, which hinders transparency and obscures the true profitability of individual segments.
Operators need to adopt new financial metrics that reflect their group units’ diversified operating models
Operators should rethink profitability metrics to better represent the performance of their increasingly diverse business groups. The following steps will help them achieve this.
- Adopt new profitability metrics that reflect the distinct cost structures and business models of each unit while remaining reconcilable at the group level.
- Improve transparency by publishing detailed financial and operational data for each business unit. This enables fair internal benchmarking and more meaningful comparisons with peers.
- Enhance investor communication by clearly articulating the shift in operating models and its impact on financial metrics. This can build support for restructuring initiatives within the investor community and highlight successes in core business areas that may be masked by group-level results.
As operators undergo transformational changes, such as delayering and moving away from vertically integrated models, they must align financial metrics with evolving operational models to ensure accurate performance evaluation and strategic planning.
For more insights and information on telecoms operators' spending trends, see Analysys Mason's Operator Spending research programme. For further details on the key concepts highlighted in this article, please contact Michela Venturelli.
1 For more information, see Analysys Mason’s Profitability of telecoms operators’ business divisions.
Download
Article (PDF)Author