Higher-income European countries have the highest capex intensities
"The capex burden in relation to income falls disproportionately on high-income countries."

Capex per capita is not especially high in Europe compared to that elsewhere, but capex intensity (capex divided by revenue) in Europe is higher than that in comparable regions. A principal factor is that Europe is a set of hypercompetitive markets, framed by pro-competition regulation that has tended to erode retail prices. In this article, we show that the richer countries in Europe tend to have the highest capex intensity.
Capex per capita clearly correlates to gross national income
Most national regulatory authorities (NRAs) in Europe publish some high-level data on telecoms investment. They all report differently, so we have some caveats about comparing them.
- Operator capex versus total market capex. An ever-increasing proportion of telecoms capex is spent by players other than the main retail market players. In fact, a substantial proportion is spent by non-telecoms operators (towercos and passive fibrecos); some telecoms capex has been offloaded onto cloud provider capex. Infraco capex can be included by NRAs, but some report just the aggregate capex of the main service players. Conversely, operators can invest in assets outside the ‘telecoms’ perimeter; indeed, Japanese operators’ aggregate capex is much higher than what the NRA reports.
- Spectrum and intangibles. We have attempted to eliminate capex related to spectrum (and other) licences from this analysis because it is very lumpy. Annualised spectrum costs for European operators totalled about EUR7 billion in 2022, which adds about EUR13 per capita per annum to total European capex and about 2.7 percentage points to the capital intensity.
We have attempted to fill in any gaps in reporting for Europe by analysing operator capex and extrapolating trends. This delivers an average for the EU27+4.1 In addition, we have included four large countries outside Europe (Canada, China, Japan and the USA) as points of comparison. There is a great deal of variation between individual countries in terms of capex per capita, but this metric broadly matches the wealth of the country (as measured by the gross national income (GNI) (Figure 1).
Figure 1: GNI per capita and telecoms capex per capita, excluding licences, Europe, Canada, China, Japan and the USA, 2022
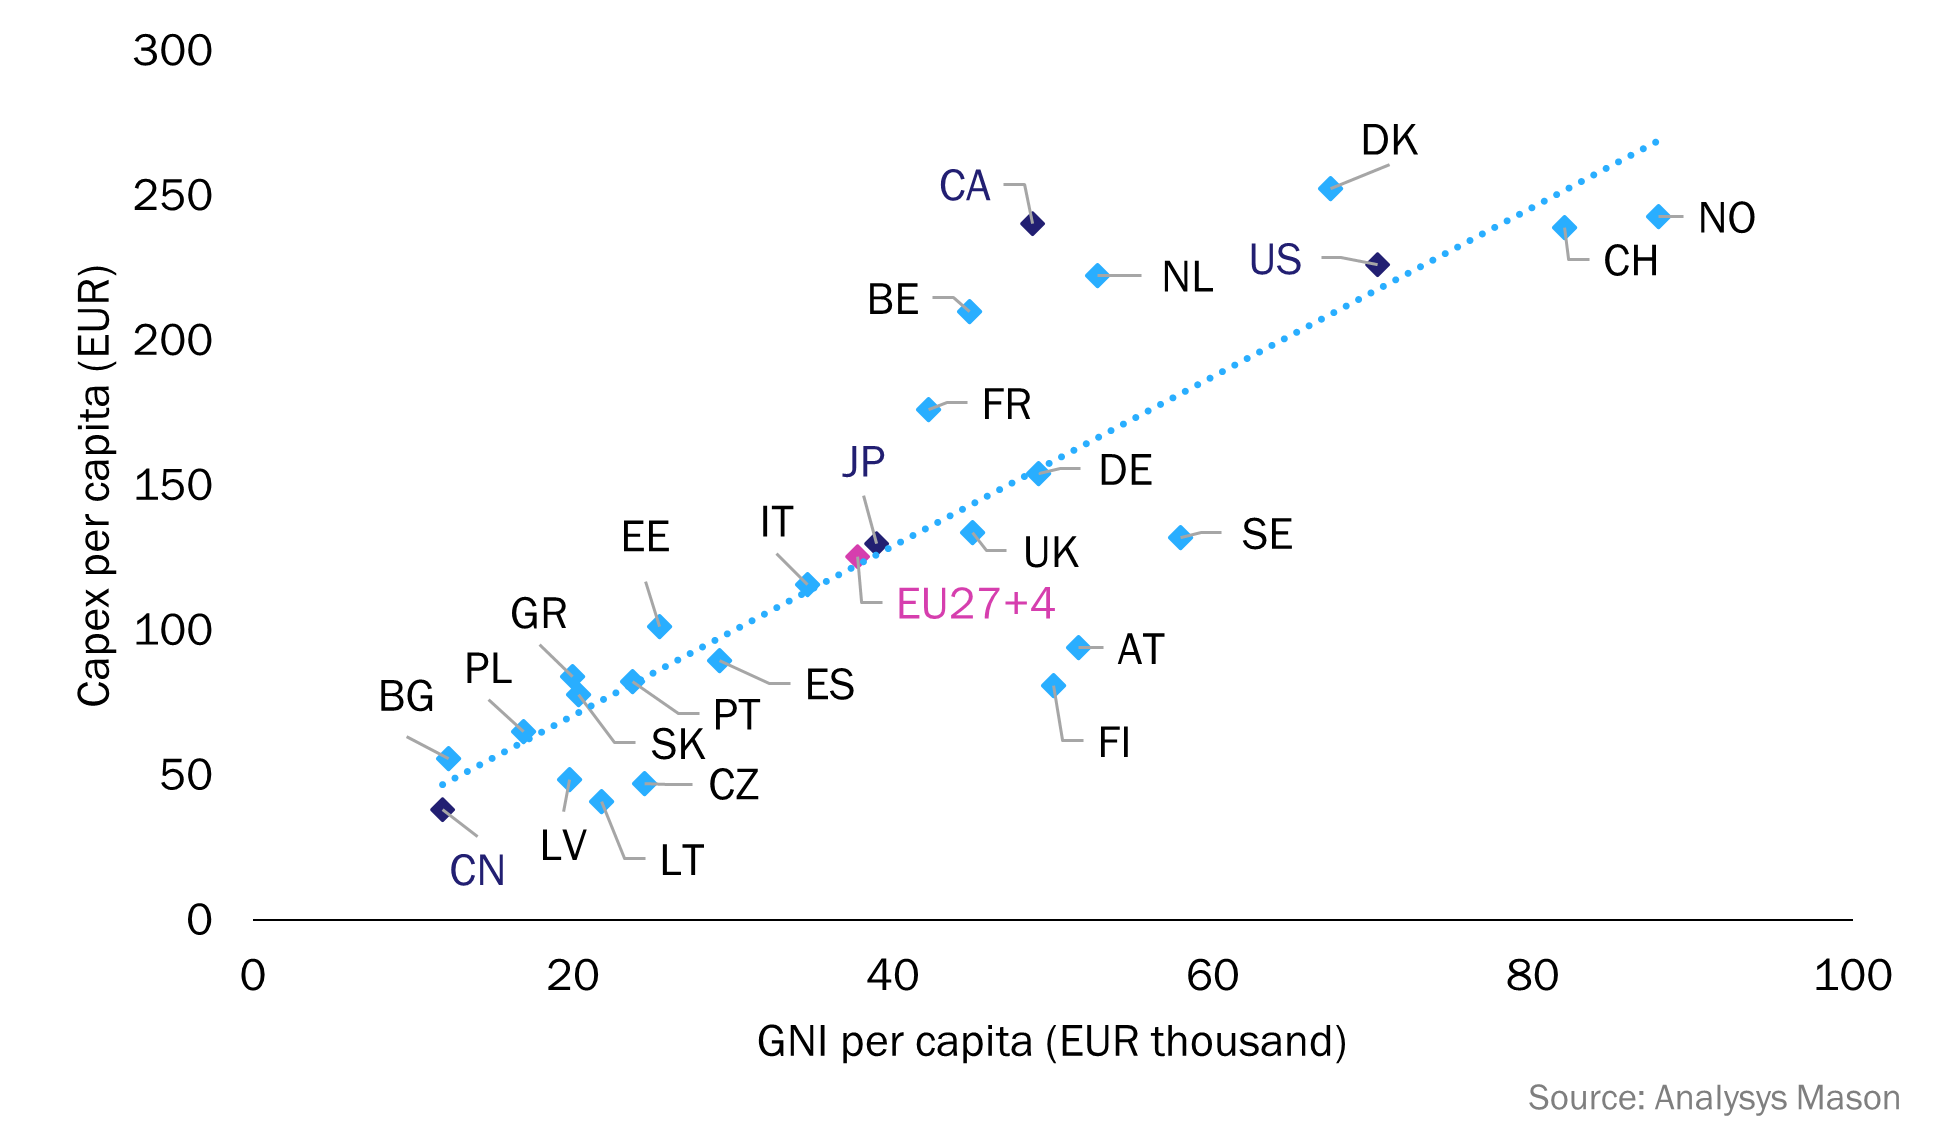
Figure 1 plots total telecoms capex, as reported by NRAs, against GNI per capita.2 A correlation between capex and wealth can clearly be discerned, but it is the outliers that are of particular interest. Their positions are related to the largest component of operator spending, the fiberisation of access, which can account for over 50% of operator capex in Europe (for more information, see Analysys Mason’s Telecoms capex: worldwide trends and forecasts 2018–2030).
- FTTP roll-out is still comparatively limited in historically mobile-centric markets such as Austria, the Czech Republic and Finland. Sweden has low capex for its wealth because it already has high FTTP penetration and achieving the last 10% of coverage is quite slow.
- Capex in Belgium, Denmark and the Netherlands is high because operators in these countries are in the midst of substantial high unit-cost FTTP roll-outs/overbuilds.
- French fibre capex has peaked, but spend is still high because France is coming to the point in a universal FTTP roll-out where the cost to pass an additional premises rises significantly. An increasingly high proportion of the spend is publicly funded.
- Operators in Canada have been markedly more ambitious in costly FTTP roll-outs than their peers in the USA, despite GNI per capita being lower.
Capex intensity is markedly higher in richer European countries
Figure 2 shows the capital intensity per capita for each European country that reports this metric. We have made assumptions to arrive at a figure for EU27+4 based on additional information.
Figure 2: Telecoms capex and revenue per capita, and capital intensity ranges, Europe, Canada, China, Japan and the USA, 2022
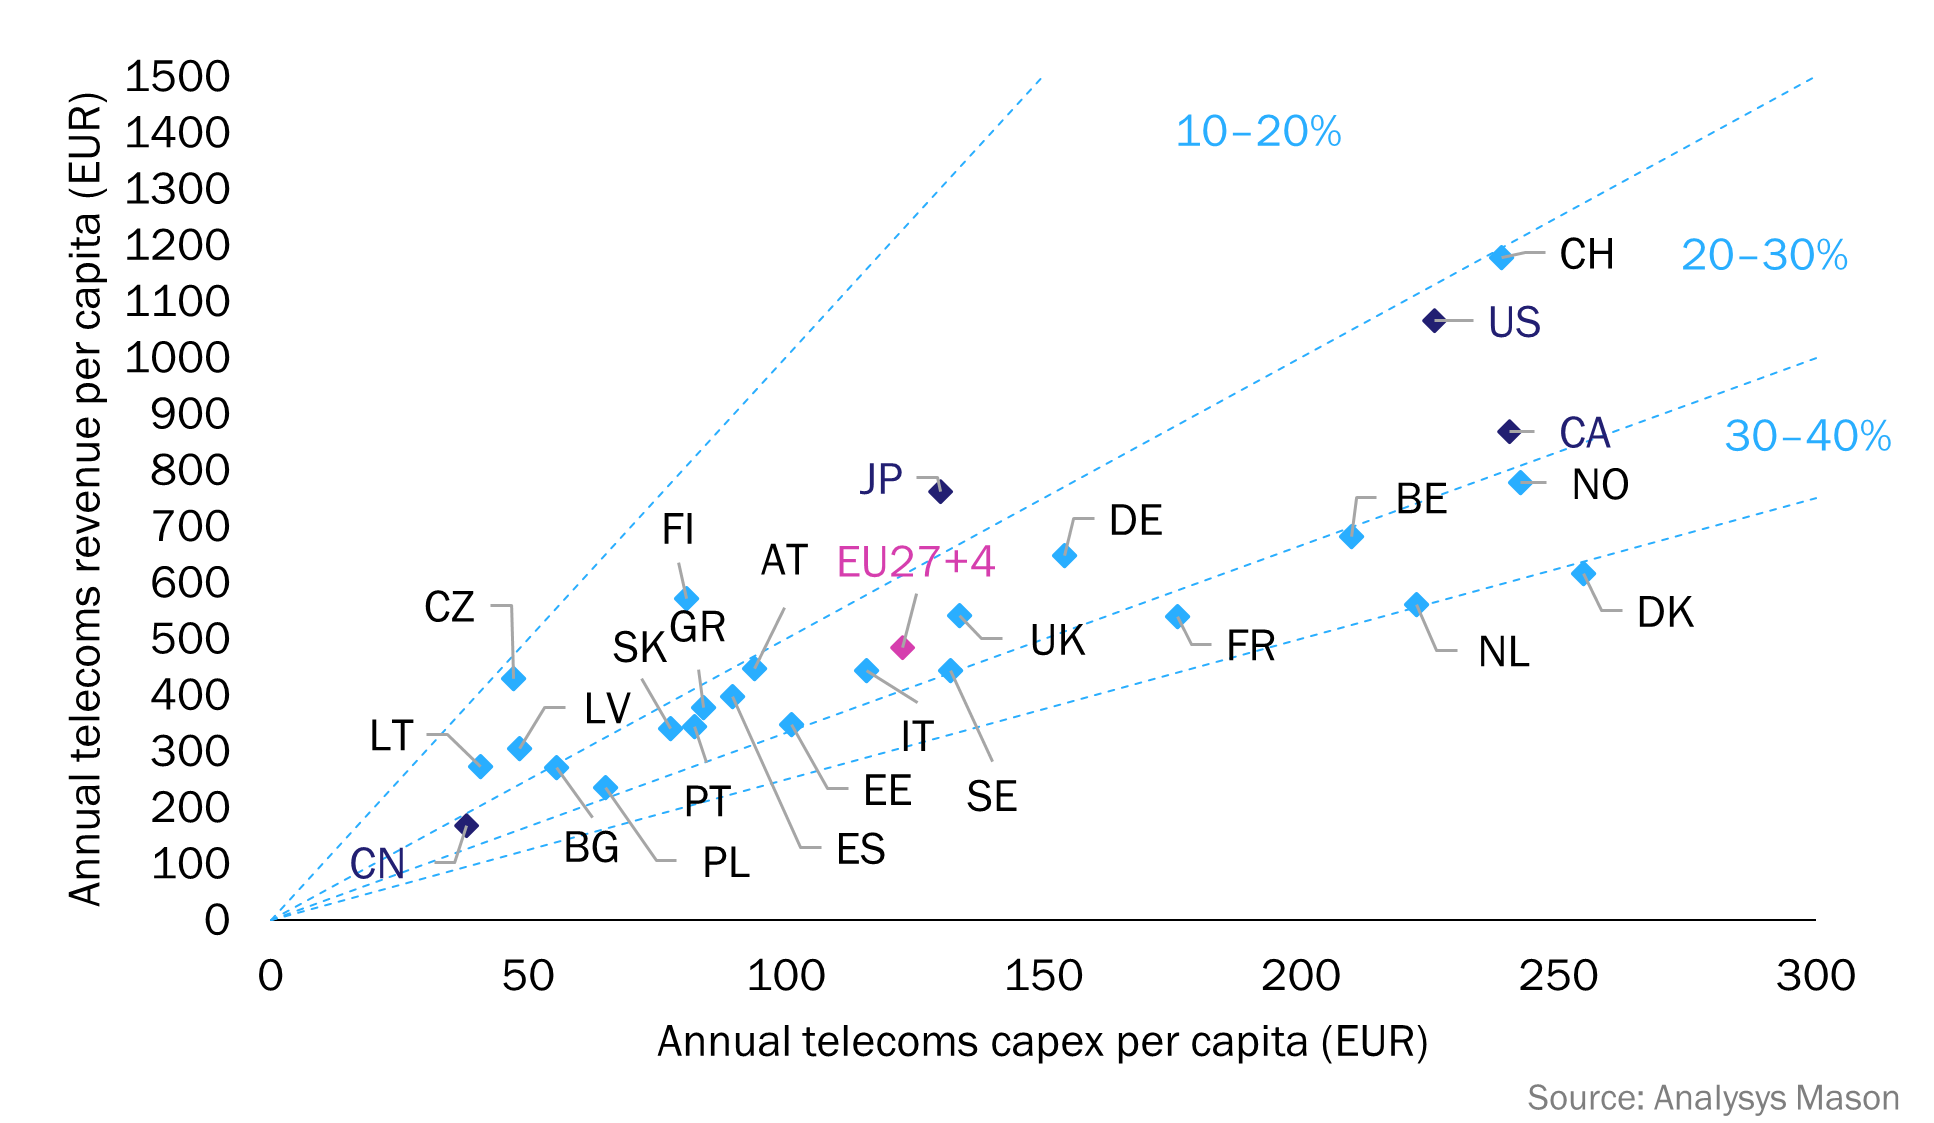
The data in Figure 2 is based on NRAs’ reporting of revenue rather than on Analysys Mason’s own bottom-up analysis, though we have estimated the data for the USA. The revenue splits that NRAs make vary considerably. Wherever possible, we have removed wholesale revenue, device sales and broadcast revenue, but sometimes NRAs do not report numerous categories of B2B service revenue.
Most of the European countries on the right-hand side of Figure 2 (all high-income countries with high capex per capita) struggle to deliver revenue to match the scale of their investments. The obvious exceptions are Switzerland and, to a lesser degree, Norway, both, probably not coincidentally, are outside the EU (although Norway participates in the single market as an EFTA member). Average revenue per capita in Switzerland is exceptionally high by European standards, but a further factor that affects where Switzerland sits in this graph was the hiatus in Swisscom’s FTTP roll-out because of a regulatory dispute.
The capex burden in relation to income falls disproportionately on high-income countries. From all indications so far, Germany is likely to join the countries at the right-hand side of the chart (including Belgium, Denmark and the Netherlands) as FTTP investment picks up.
FTTP is a huge capex burden. Rich European countries find it harder, even in relation to their wealth, to deliver universal gigabit coverage than poorer ones, and hence we see more substitution of FTTP by fixed-wireless access (FWA) in richer countries. Construction costs vary greatly, and a principal factor is the cost of labour, which is directly related back to income levels; willingness to pay and ARPU vary much less in relation to income levels.
So would telecoms operators have performed better by following the lead of Finnish operators? Finland is the only country in Europe where the NRA reported a larger investment in mobile networks than in fixed networks in 2022, and as such, Finland has a low capital intensity. The argument against this view is that FTTP investment is in assets with very long useful lives and high capex now delivers lower capex intensity in the future, even if demands made on networks pick up again. Countries and operators with completed FTTP coverage do typically enjoy lower capex intensity. However, what we could also see is that mobile capex will, like fixed, eventually fall away as incremental costs to deal with additional demand fall rapidly. We will return to this important theme in the coming year.
1 EU27 + Iceland, Norway, Switzerland and the UK
2 The FCC does not publish this data. The combined network capex of the big five operators stood at USD72.4 billion in 2022, so we have provided an estimate of USD79.7 billion.
Article (PDF)
DownloadAuthor