Which operator is top of the sustainability leaderboard? Using benchmarking to see who is performing best
02 July 2025 | Research and Insights
Article | PDF (4 pages) | Sustainable Networks | Sustainability
"Operator benchmarking enables telecoms players to better understand the effectiveness of their investment in reducing their environmental impact."

While the telecoms industry continues on its journey towards net zero, there is a critical industry need to understand how much progress is being made. Environmental, social and governance (ESG) credentials can be decisive in the fight for customers, strategic investors and debt funding. Telecoms operators must understand how they compare to peers, while regulators require metrics to assess sustainability across the sector. Investors and banks require strategies to identify or certify ESG compliant investments or loans.
However, the complexity of operators’ businesses means that establishing benchmarks for fair comparison is challenging. Operators have diverse infrastructures that include combinations of fibre, cable, PSTN, mobile or other network technologies, with varying topologies, equipment generations and business models. They each face disparate geographical, political, economic and energy challenges.
Despite their differences, it is essential to understand what good environmental performance looks like in telecoms. Operators and other stakeholders need to know who is at the top of the sustainability leaderboard, who is at the bottom of it, and what industry average performance looks like. They also need to understand the factors influencing performance. Context is critical.
Analysys Mason has developed the following benchmarking methodologies to make reasonable comparison between operators possible.1
- Index of improvement. This measures how much an operator is improving (or not) and enables progress comparison against its peers.
- Benchmark by number of connections. This is a broad measure of environmental impact that can be used to compare companies that have similar customer bases (including overall size or mix of fixed and mobile services). More-precise metrics (based on confidential survey data) compare operator performance against specific fixed and mobile criteria, such as energy per mobile customer, per local exchange or per mobile site).2
- Benchmark by revenue. A benchmark that shows how operators’ revenue carbon intensity compares with others in the industry. It helps to answers questions about whether operators are generating more carbon for every USD of revenue than their rivals. Further analysis can compare similar groups, such a those in emerging or developed markets.
The metrics presented within Analysys Mason’s Sustainable Networks research programme, are complemented with contextual analysis to enable a proper understanding of operators’ individual and collective progress.3
Benchmarking improvements can help to show how the industry as a whole is progressing
Analysys Mason’s data sets, combined with our broader analysis, are yielding valuable insights into what constitutes industry best performance, and what constitutes industry-leading improvement. Our analysis also reveals why some companies are making great progress while others are struggling. Factors such as geography, access to renewable energy, legacy technology mix, new technology deployment choices, board-level aspirations, internal organisational structure, product mix, use of green financing4 and regulation all play a role.
For instance, examining operators' efforts to reduce Scope 1 carbon emissions exposes significant disparities. Top performers have managed to drive down their Scope 1 emissions in recent years – the best of them by nearly 80%. Conversely, the worst performer (among those with complete data) emitted more Scope 1 carbon in 2023 than in 2018. The average reduction among the world’s largest operators was 17.74% over 5 years.
Figure 1: Change in operator Scope 1 carbon emissions, expressed as an index5
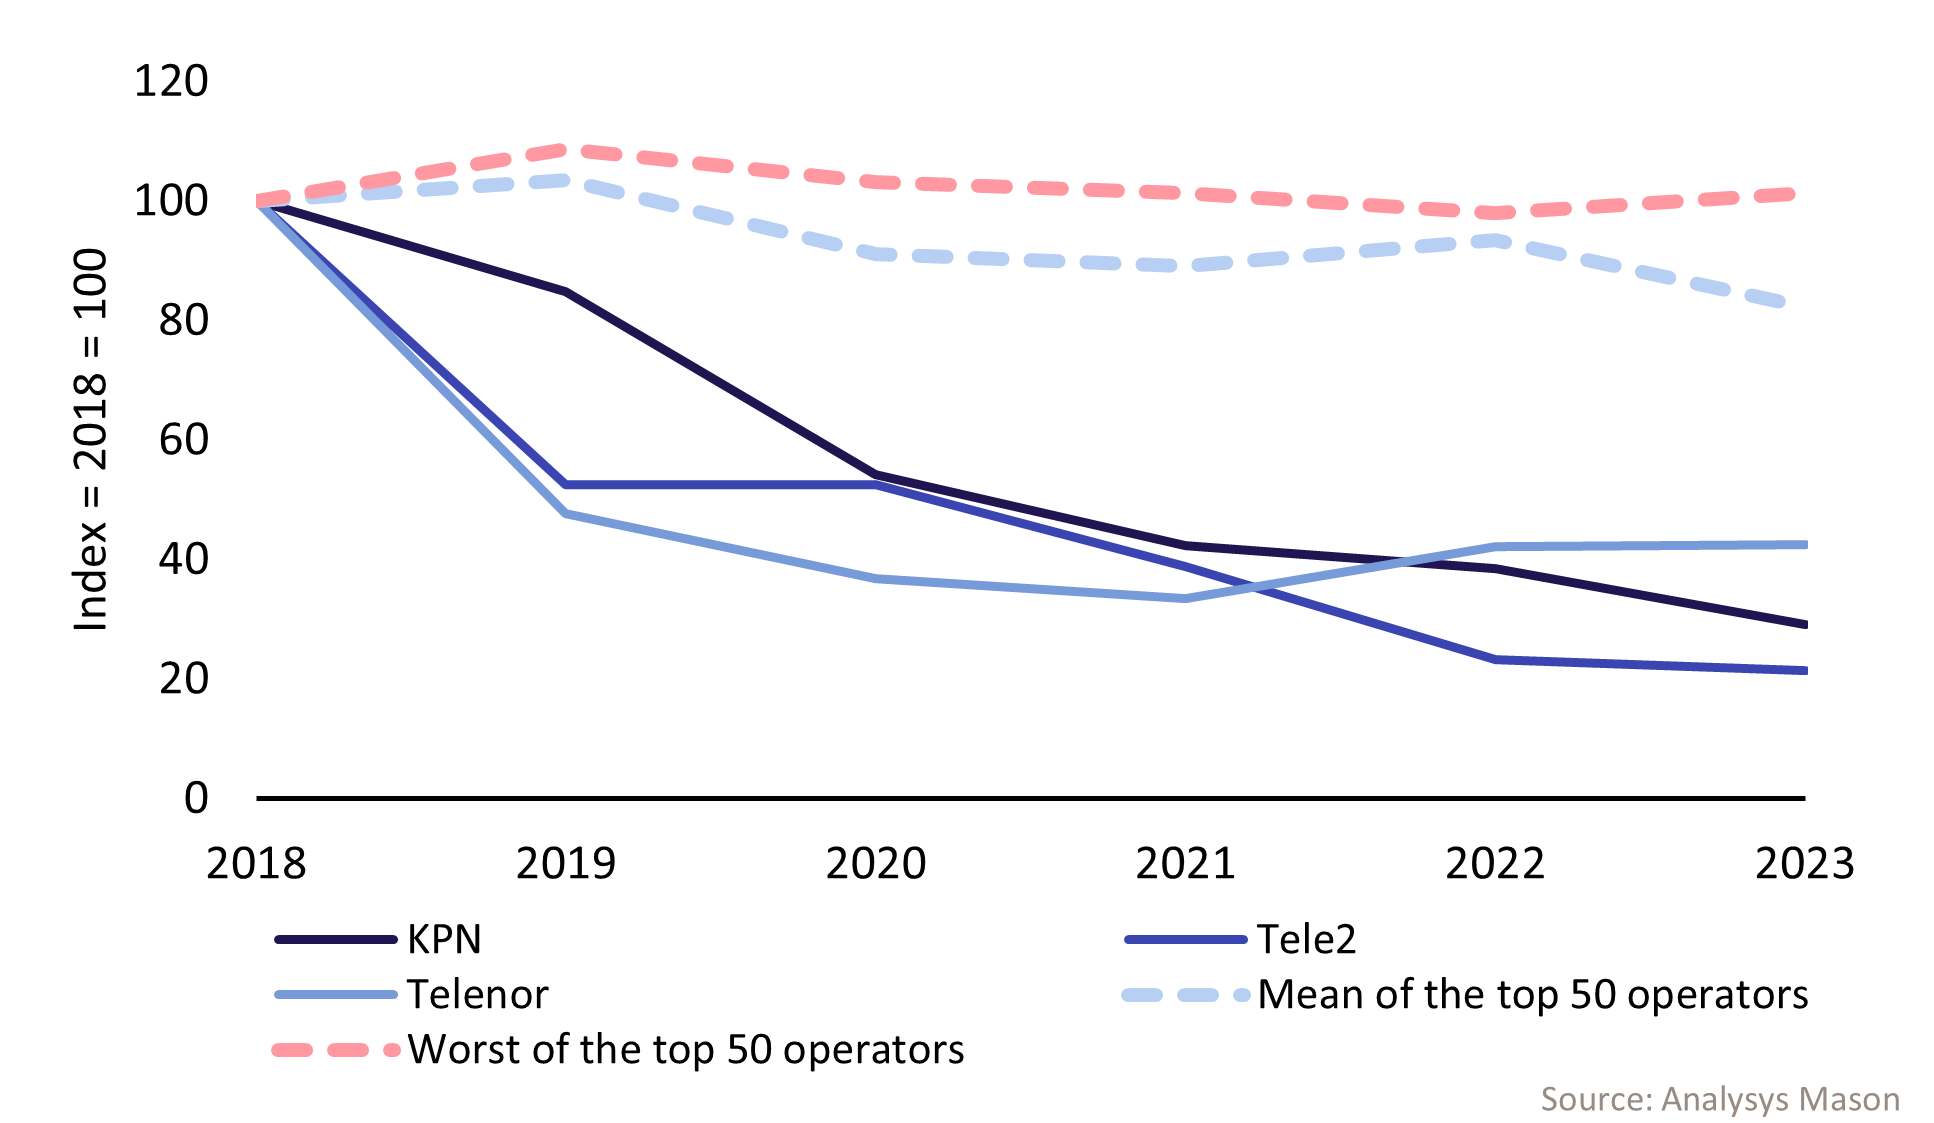
Many leader operators benefit from access to reliable, low-carbon grids and renewable energy infrastructure, and have invested early in electric vehicles (EVs).6 Those facing challenges often operate in countries with extensive rural areas where grid reliability or availability is low. They typically use diesel generators for local network infrastructure, and fossil-fuelled vehicles for deployment, maintenance or upgrade tasks at remote sites because EVs cannot be charged. However, some industry leaders have emerged from these regions too. They are installing on-site renewables, sharing infrastructure and deploying advanced battery storage solutions to cut energy usage and diesel dependency. Their actions demonstrate that geographic and infrastructure challenges are not insurmountable.
Benchmarking performance ranges can show how far ahead of (or behind) its peers an operator really is
While index-based approaches enable analysis of progress over time, industry average performance data offers a complementary view of how a company compares to its peers. In addition, understanding the extremes demonstrates whether a company is an industry leader or an industry laggard. For instance, Figure 2 illustrates the difference between industry average and industry worst annual energy intensity per connection across the top 50 global telecoms operators. Average energy consumption per connection across the cohort was 59.4KWh in 2023. In contrast, the industry-worst energy consumption per connection was over 340KWh per year – many times higher than the average. The best figures, meanwhile, come in well below 10KWh per connection.
Figure 2: Annual energy consumption per connection, highest value among and mean of the top global operators
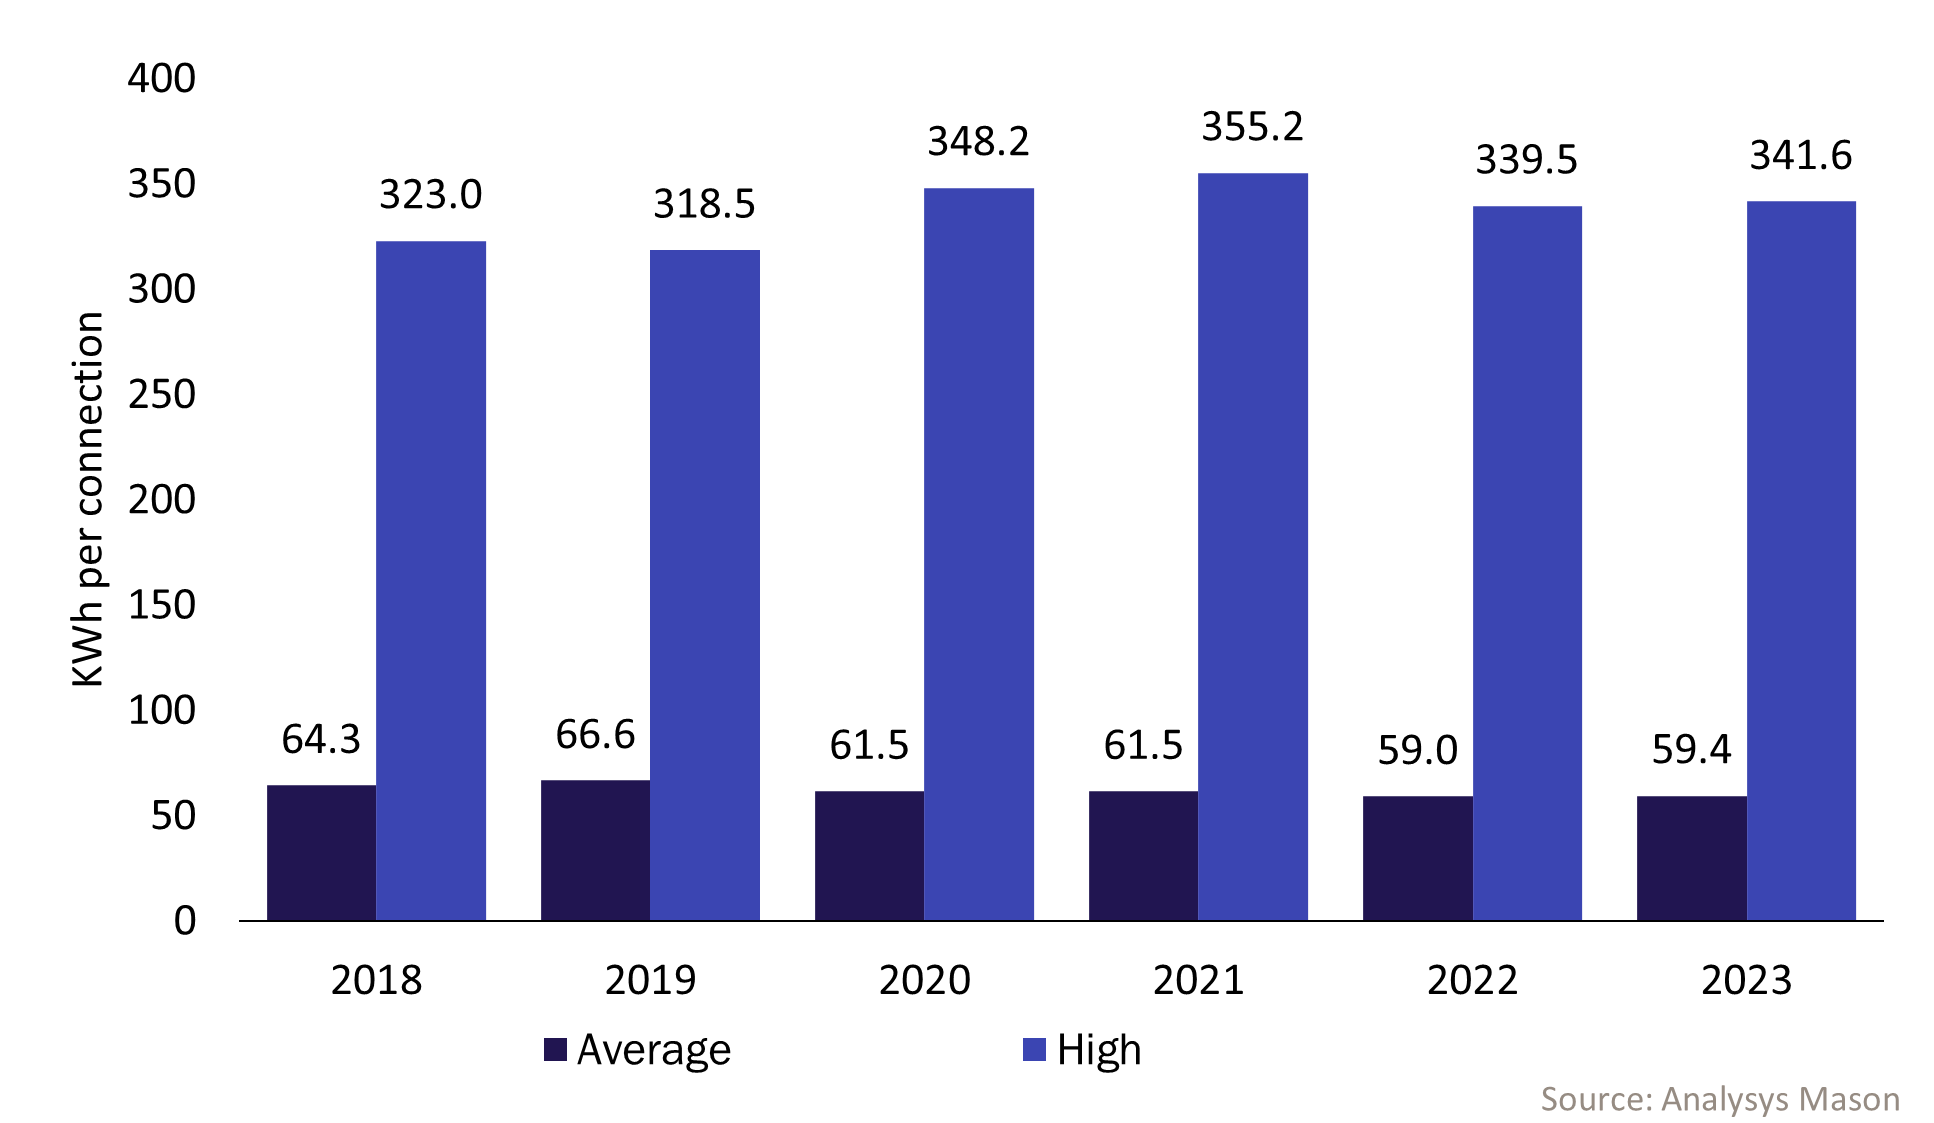
Factors contributing to these differences include (among many others) reduced energy consumption due to the decommissioning of legacy fixed and mobile technologies, new technology investments (that might increase or decrease energy usage) or increased energy usage consumption at data centres.7 A major contributor to apparent energy efficiency for mobile operators is outsourcing of tower operations. For example, Airtel reports that the energy it uses at cell sites owned/managed by third parties is nearly 13 times higher (collectively) than its energy use at its own sites. However, this energy is often reported separately – or not at all – by operators. Extensive use of towercos (especially those managing active infrastructure) means that assessing true network energy use requires analysis of both the operator and its tower partners.
As operators release their 2024 datasets, Analysys Mason will continue to evaluate and report on the industry's progress towards carbon neutrality, energy reduction, and waste reduction. We will investigate how different operational and technological strategies are shaping environmental outcomes, and highlight best, average and worst performers across a range of detailed telecoms-specific sustainability metrics. Our analysis will go beyond headline figures to uncover the underlying drivers of performance – to help operators, regulators, lenders and investors understand who is really top of the leaderboard, and why.
See our website for more details about Analysys Mason’s Sustainable Networks research programme. Contact Simon Sherrington if you would like to discuss this article, or if you would like to know more about Analysys Mason’s research coverage in this area.
1 See Analysys Mason’s Telecoms operators’ environmental KPIs: trends and analysis and Environmental KPI tracker: telecoms operators.
2 See Analysys Mason’s Mobile operator energy benchmarks 2024 and Fixed operator energy benchmarks 2024.
3 In addition to telecoms operators, Analysys Mason has developed benchmarks for a variety of other companies in the technology, media and technology (TMT) sector. Other relevant publications include Analysys Mason’s Environmental KPI tracker: hyperscalers and cloud providers, Environmental KPI tracker: vendors, Tower companies’ environmental KPIs: trends and analysis and Semiconductor companies' environmental KPI tracker: trends and analysis.
4 See Analysys Mason’s Operators that set ambitious KPIs will be better placed to gain capital from sustainability-linked finance.
5 Many operators have yet to publish 2024 performance data.
6 See Analysys Mason’s Telecoms operator renewable energy benchmarks 2024.
7 See Analysys Mason’s Mobile operator energy benchmarks 2024, Fixed operator energy benchmarks 2024 and Operator data-centre energy benchmarks and the impact of AI for more details on specific energy usage benchmarks.
Article (PDF)
DownloadAuthor

Simon Sherrington
Research Director, expert in fibre infrastructure and sustainabilityRelated items
Podcast
Financing connectivity: how impact investors are bridging the digital divide
Podcast
Re-thinking sustainability: Liberty Global's solution for unlocking value from unused tech
Tracker
ESG standards and goals: space organisations 2025