Telco energy consumption keeps rising even though energy per bit is coming down
"Reductions in energy per PB of traffic can be misleading, as they may mask rising total energy consumption."

Analysys Mason’s Environmental KPI tracker: telecoms operators 2H 2025 reveals that operators worldwide have not been able to reduce energy per petabyte (PB) of traffic fast enough to drive down total energy consumption, with total energy use rising by 9% between 2021 and 2024.
The tracker now includes over 100 Tier 1 and Tier 2 operators worldwide, covering more than 20 000 data rows and 200 data series benchmarking energy, emissions, waste and water. The tracker added per employee and PB of traffic benchmarks, delivering an extensive view of sustainability performance across the global telecoms sector.
Environmental benchmarks are most useful when viewed in context, and our analysis helps interpret the numbers and shows how operators are truly progressing in becoming more sustainable.
Energy per PB of traffic fell by 44% between 2021 and 2024, with preliminary 2025 data indicating further declines
Energy per PB of traffic ranged from 36–199MWh/PB, averaging 83MWh/PB.1,2 Operators at the upper end of the range operate large, geographically dispersed networks and have yet to fully decommission legacy assets.
Figure 1: Energy per PB of traffic,3 worldwide
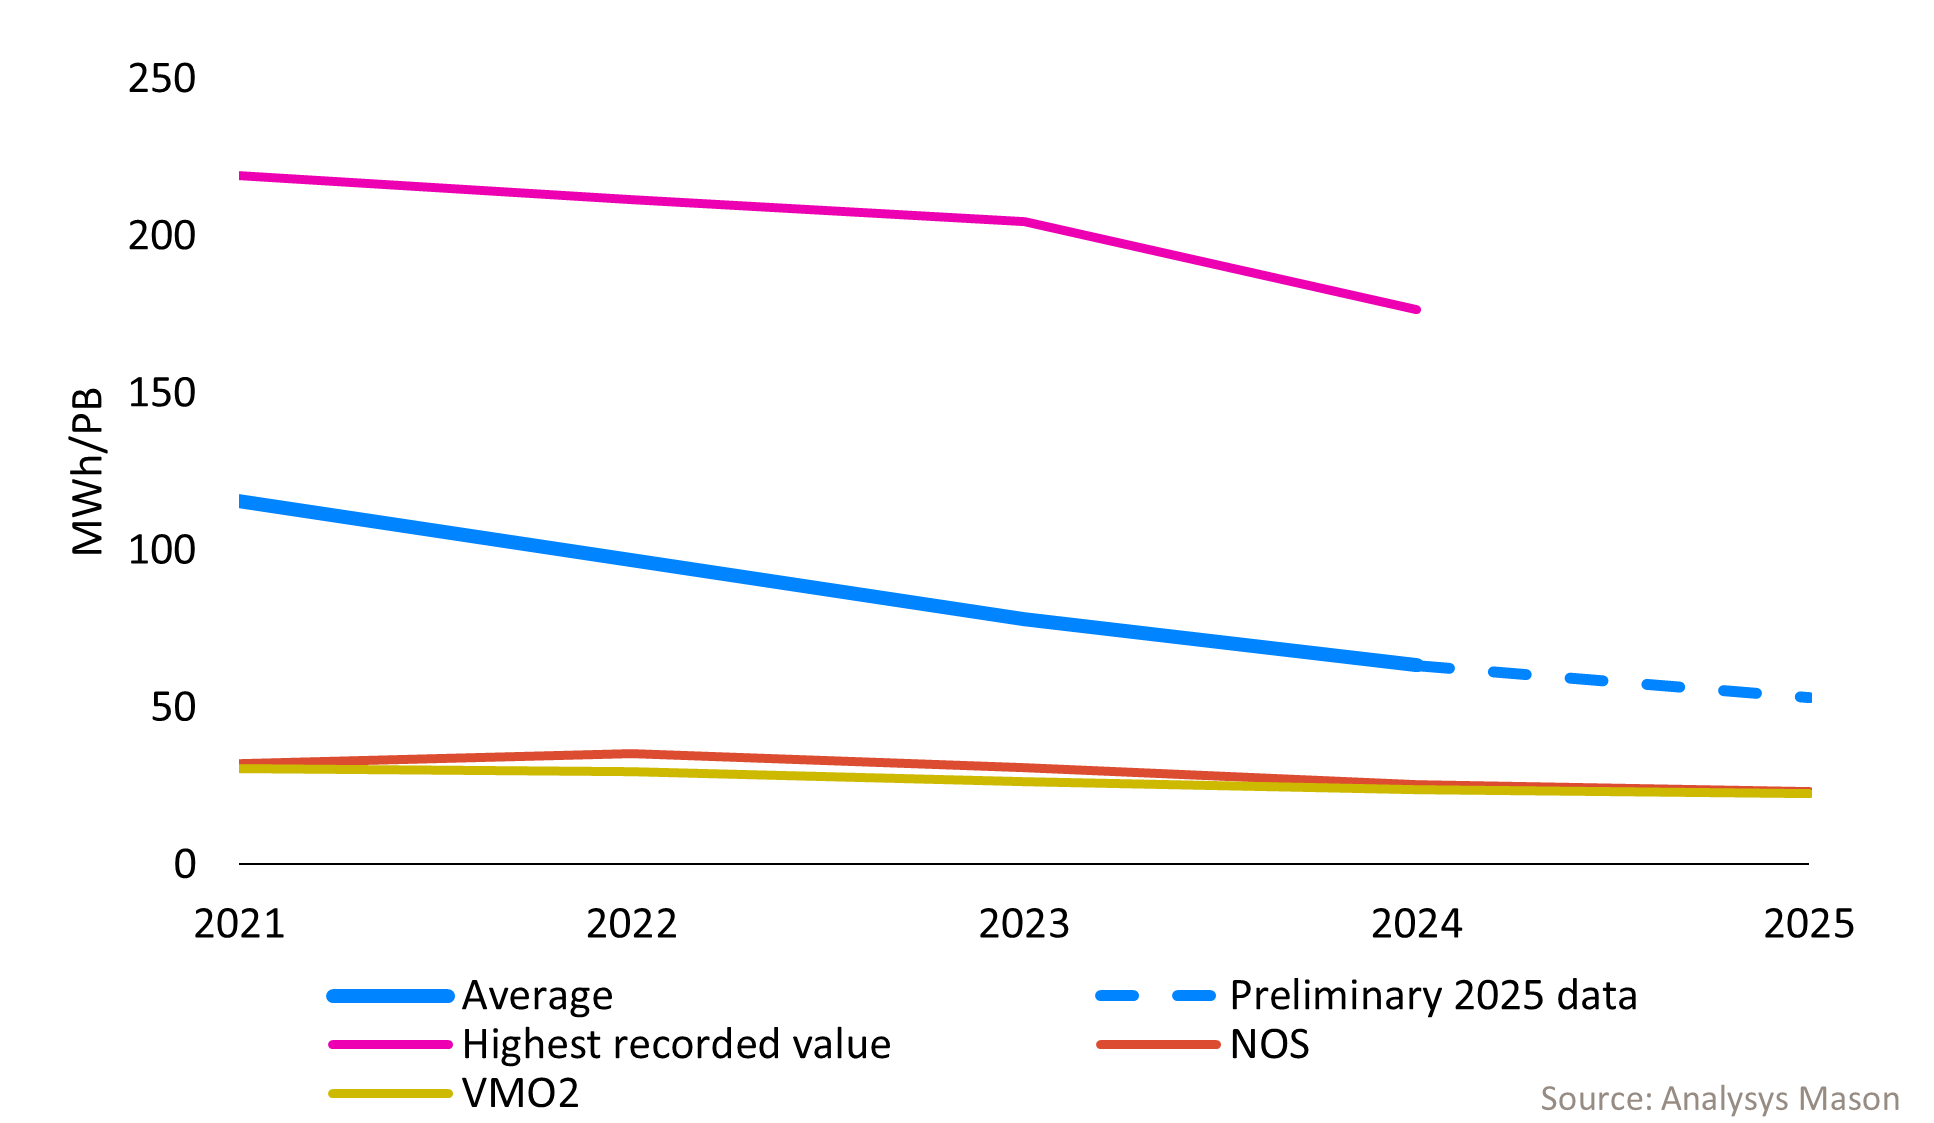
On average, operators used 44% less energy per PB of traffic in 2024 than in 2021. While only ten operators from our sample have reported data for 2025, their data suggests the downward trend will continue, with average energy per PB of traffic falling by a further 9% between 2024 and 2025.
AIS reported the largest reduction in MWh/PB, at 76% between 2021 and 2024, followed by a further 2% decline in 2025. This sharp decline was driven primarily by significant traffic growth of over 500% between 2021 and 2025. In fact, AIS reported a 32% increase in total energy consumption during the same period.
T‑Mobile USA reported the second‑largest reduction in energy per PB of traffic, at 71% between 2021 and 2024.4 Despite traffic rising by more than 200%, the company reduced total energy consumption by 7%, coinciding with the shutdown of T‑Mobile’s 3G network in 2022.5 T-Mobile USA also highlighted AI‑based optimisation at network sites, and equipment performance adjusted dynamically based on real‑time traffic patterns, as key energy management strategies.
Reductions in energy per PB of traffic can be misleading, as they may mask rising total energy consumption
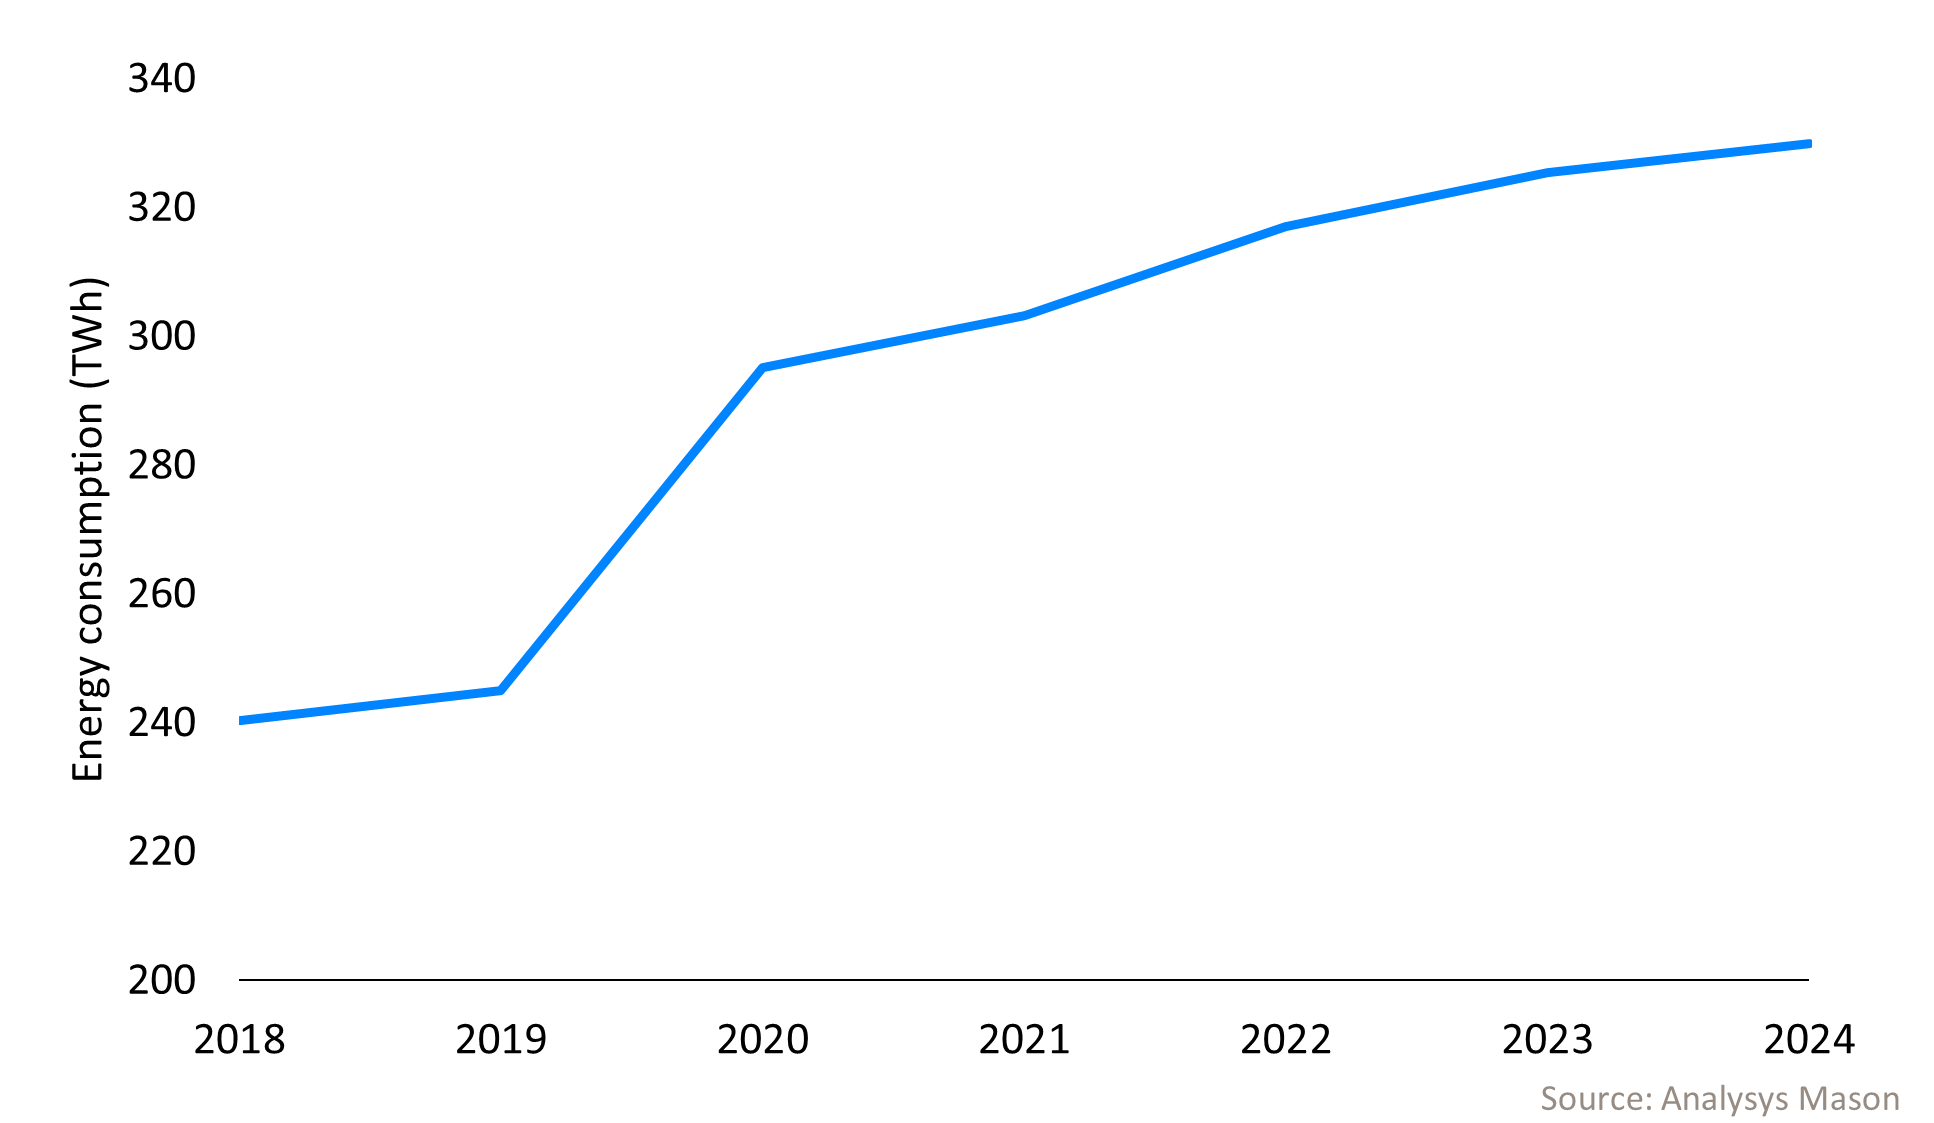
Despite a 44% reduction in energy per PB of traffic, total telecoms operator energy consumption increased by 9% between 2021 and 2024, and by 37% between 2018 and 2024. This growth has been caused by a variety of factors including deployment of new network infrastructure alongside legacy systems, infrastructure upgrades with energyintensive equipment, and growth in demand for data centre operations. Across the industry, energy management strategies have failed to mitigate these upward pressures on total energy consumption.
Figure 2: Total operator energy consumption, worldwide
In contrast to energy per PB, energy per employee is generally rising year on year
Analysing energy per employee uncovers another set of industry dynamics.
In 2024, energy per employee6 ranged from approximately 10MWh to 180MWh, averaging 72MWh per employee.7
The lowest energy per employee figures among our study group were reported by TELUS, Comcast and Proximus (10.2MWh, 32.4MWh and 32.5MWh per employee, respectively). TELUS’s figure reflects, in part, the expansion of its digital platforms and enterprise services businesses under the TELUS Digital brand, which are relatively less energy‑intensive than its network operations but account for more than 70% of its workforce.8
Across the sample, average energy per employee increased by 7% between 2021 and 2024. Telstra was the strongest performer, cutting energy per employee by 25%. This improvement reflects a 20% reduction in total energy consumption, driven by a combination of HVAC optimisation, sleep‑mode deployment, liquid cooling and the decommissioning of its 3G network in 2024. Telstra’s workforce expanded by 5% as the company grew its non‑core service activities, contributing to the decline in energy per employee.9 The weakest performer reported an increase in energy per employee of 65% between 2021 and 2024. In 2024, the operator deconsolidated its fixed network assets, resulting in a 48% reduction in staff while total energy consumption fell by only 15%.10
Operators must take a holistic approach to energy analysis and reporting
Headline energy per PB of traffic reductions can be deceiving, as they can mask strong growth in total energy consumption. Only a few operators – including Deutsche Telekom, T‑Mobile USA, Telefónica and Swisscom – have reduced total energy consumption fast enough to offset the impacts of their infrastructure investments and growth in demand. Analysys Mason provides detailed analysis of the strategies that operators globally are using to cut their total energy consumption.
Operators need to take a holistic approach to energy analysis and reporting to accurately assess energy efficiency and risk. The Sustainable Networks programme provides a comprehensive set of benchmarks – not only energy per PB of traffic, per employee, per connection and per USD of revenue, but also energy shares by network domain and comparisons across different network architectures, generations and technologies – at global, regional and national levels.
1 Based on a group of 30 reporting operators.
2 Energy per PB of traffic is calculated by dividing total energy consumption (MWh) by total traffic volume (PB).
3 2025 data is preliminary.
4 As of April 2026, T-Mobile USA had not reported its 2025 data.
5 While T-Mobile’s total energy use increased by 7% between 2021 and 2022, it fell by 10% between 2022 and 2023.
6 Energy consumption per employee figures, calculated using total group energy consumption (including network infrastructure).
7 Based on a group of 50 reporting infrastructure-based operators.
8 When TELUS Digital’s headcount and total energy consumption are excluded, TELUS’s energy per employee rises to 36.9MWh.
9 Excluding a 6% rise in staff linked to non‑core services, Telstra’s energy use per employee fell by 20% between 2021 and 2024. This is still the largest reduction across the cohort.
10 In 2024, TIM Group deconsolidated its fixed network infrastructure assets, resulting in a 48% reduction in staff while total energy consumption fell by only 15% and in 2025, this energy decreased further. The main reason for the unexpectedly low impact of deconsolidation was the fact that the company reported a rise in reported data centre energy as the total energy consumption from its Olivetti operations were incorporated into reporting for the first time.
Author

Grace Langham
Senior Analyst, expert in sustainability and ESGRelated items
Tracker
Operator initiatives to reduce downstream customer related emissions and end-of-life impact 2026
Article
KPN leads its peers on downstream emissions and waste, but all European operators have more to do
Framework report
Benchmarking telecoms operator strategies to reduce downstream customer-related emissions, waste and end-of-life impact