D2D services must balance capabilities, expectations and willingness to pay
19 December 2025 | Research and Insights
Lluc Palerm | Christopher Baugh
Article | PDF (5 pages) | Defence and Sovereign Space| Earth Observation| Emerging Space Applications| Satellite Broadband| Satellite Capacity| Satellite D2D| Satellite Manufacturing and Launch| Satellite Mobility| Satellite Networking Technologies | Space
"Effective direct-to-device (D2D) collaboration between telecoms and satellite operators depends on performance-to-price metrics matching user expectations."

The Starlink direct-to-device (D2D) service in the USA continues to suffer from brief satellite visibility outages and limited coverage, even though its constellation now numbers more than 650 satellites. The aggregate downstream capacity for this D2D constellation in the USA is approximately 10Gbit/s, according to Analysys Mason’s Non-GEO Constellations Analysis Toolkit (NCAT) 6.0.
Mobile network operators that want to set realistic user expectations around D2D should draw from analytics platforms such as NCAT for a detailed assessment of satellite services and capabilities. D2D performance depends on a combination of factors: available spectrum and spatial reuse, satellites in view, satellite transmit power and receiver sensitivity, user distribution and regulatory limits such as power-flux-density (PFD) constraints. Ultimately, a successful D2D service roll-out must strike a balance between the available capabilities at the time and users’ interest and willingness to pay.
The densification of the Starlink D2D constellation continues, but coverage and availability challenges persist
As of December 2025, the Starlink direct-to-cell (D2C) constellation included 653 very low-Earth orbit (VLEO) satellites: 336 in inclination orbits of 43° and 317 at 53°. The constellation’s deployment in 2025 focused on the 43° shell, which improved mid-latitude coverage persistence. Regions above 57° latitude remain uncovered, but visibility across mid-latitude regions has strengthened considerably.
Figure 1: NCAT simulation of the Starlink D2C constellation and visible-satellite counts across US latitudes, December 2025
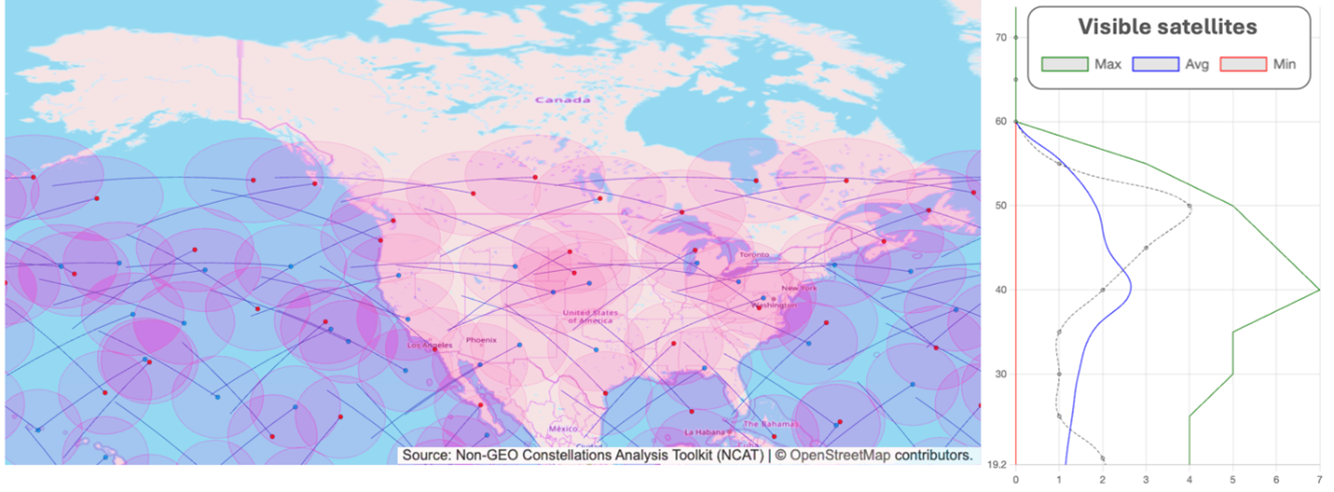
Despite its 650+ satellites, the very low altitude of the constellation still poses a challenge to continuity of service, especially since smartphones often require elevation angles above 30° for a stable link. Most of the continental USA has at least one satellite in view. Mid-latitude regions now average around two visible satellites, with occasional peaks of five to six, though brief outages (when no satellite is in view) still occur.
T-Mobile expands to incorporate basic data services in selected third-party apps
T-Mobile commercially launched its Starlink-powered T-Satellite service in the USA in July 2025. The initial focus was on messaging and location-sharing, but T-Mobile recently expanded the service to a selected group of third-party apps. Supported apps now include WhatsApp, AllTrails, AccuWeather, Google Maps, CalTopo and X. The service is either bundled with T-Mobile premium plans or comes with a USD10-per-month add-on fee for other users (including subscribers from competitors).
This ‘apps-support’ feature, which debuted with KDDI’s au Starlink Direct in Japan, is generating strong user interest. Early adopters have shared their positive experiences on social media and other public platforms, noting that they can now use SMS and popular apps in remote areas.
Enthusiasm aside, the fundamental question remains: Can D2D services scale to support potentially millions of rural or off-grid users with acceptable performance? NCAT’s new D2D assessment capabilities were used to model Starlink–T-Mobile supply and demand, focusing on how concurrent users affect achievable bandwidth.1
NCAT simulation framework
Several assumptions were applied to ground the analysis in realistic system behaviour:
- Spectrum and beams: Starlink D2C satellites support hundreds of beams across multiple bands. The simulation modelled 5MHz PCS-G channels (5MHz uplink + 5MHz downlink) with 16× spatial reuse, allowing up to 16 simultaneous full-power beams per satellite. Beam hopping was included for dynamic capacity allocation.
- Link budget: NCAT defaults were tuned for real-world wireless conditions, including link attenuation. Satellites were assumed to employ coding similar to 5G-NR, despite current LTE operations.
- Concurrent users: T-Mobile has around 140 million US subscribers, and Starlink D2C’s beta test involved 1.8 million participants. The number of users currently enabled for apps is uncertain, but it is likely to be in the hundreds of thousands to low millions. For modelling, 10 000 concurrent users were assumed to be accessing apps in areas without terrestrial coverage and with sky visibility above 30° elevation.
- User demand: Each user was modelled to require 1Mbit/s downstream.
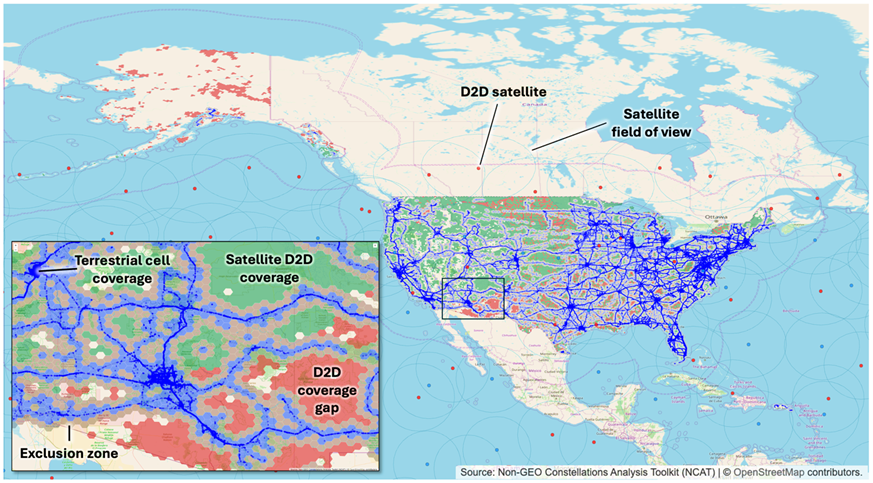
- Distribution and exclusion areas: According to T-Mobile, at least 13% of US land area lacks terrestrial tower coverage. NCAT-provided tower locations and associated exclusion zones were used to realistically distribute users.
Figure 2: T-Satellite NCAT simulation, December 2025
NCAT simulation findings
The simulation produced several key insights:
Satellite visibility and capacity
Roughly 40 satellites are visible from US territory at any given moment, offering an aggregate downstream capacity of approximately 10Gbit/s. However, this is a nationwide total; individual locations typically see only 0–2 satellites at once. Combined with spatial variations in user distribution, effective utilisation of visible capacity lies in the range of 50–70%.
User speed versus concurrency
With 10 000 concurrent users each requesting 1Mbit/s, modelled average downstream speeds drop to about 500–700kbit/s per user. Per-user speed decreases roughly in inverse proportion to the number of users because beam capacity is shared. Under the same assumptions, 100 000 concurrent users would receive only about 50–70kbit/s each.
Local variability
These results reflect national averages, but actual performance can vary widely by time and location. Some areas may experience outages, while others may encounter contested service. In contrast, locations with multiple satellites in view and low user density may achieve much better performance.
Balancing capabilities with expectations and willingness to pay is critical to successful D2D roll-outs
D2D service plans and user expectations will need periodic recalibration because the technology is evolving rapidly. Positive user feedback on T-Satellite apps demonstrates that speed-versus-capacity trade-offs can be managed effectively, especially when paired with a thoughtful pricing strategy.
Pricing will be essential for both network-reward maximisation and user-expectation management. Mobile users are willing to pay extra for data access: Analysys Mason’s latest survey report shows up to 27% of respondents would pay a premium for D2D data services, a higher willingness than for messaging.
In short, successful D2D partnerships will require not only strong technical architectures, but also data-driven performance and carefully constructed pricing frameworks. Tools such as NCAT will be essential for regularly calibrating these frameworks as constellations densify and D2D evolves from early adoption to mainstream mobile connectivity.
Analysys Mason has over 30 years’ experience of providing space research, insights and strategic advisory to clients throughout the value chain. From market assessments and data-driven analyses to complete space strategy development, we have extensive expertise in helping our clients navigate the rapidly evolving space domain. For more information on our space capabilities, please visit Space Industry Consulting and Research Services | Analysys Mason.
This article was authored with the support of Carlos Placido.
1 No confidential or proprietary data was used in this NCAT-supported article. Upon request, NCAT users can access an expanded report generated by the NCAT AI agent, as well as detailed simulation documentation, satellite payload specifications and CSV output files containing granular data for all 36 812 US ground grid cells.
Article (PDF)
DownloadAuthors

Lluc Palerm
Research Director, expert in satellite communications
Christopher Baugh
Partner, expert in space and satellite telecomsRelated items
Article
Strategic ecosystem alignment will fuel growth in the satellite-enabled connected car market
Article
Satcom operators can turbocharge the space economy through launches, pricing and partnerships
Article
Satellite operators becoming manufacturers will benefit from SaaS, despite market fragmentation